Electrochemistry Software Electrochemist.com separate the overlapped peaks of CV.
(Click on graphs to enlarge.)
Picture 1.
DC. The current rises with increasing voltages up to a limiting value.
Please click here to download the parameter file,
open the parameter file in software Electrochemist.
Picture 2.
As above, but click the Plot menu, Option menu, untick the "x axie from + to -" to change the x-axie direction.
Picture 3.
CV, scan rate = 1 kv/s, fit a simulated curve to experimental CV.
Picture 4.
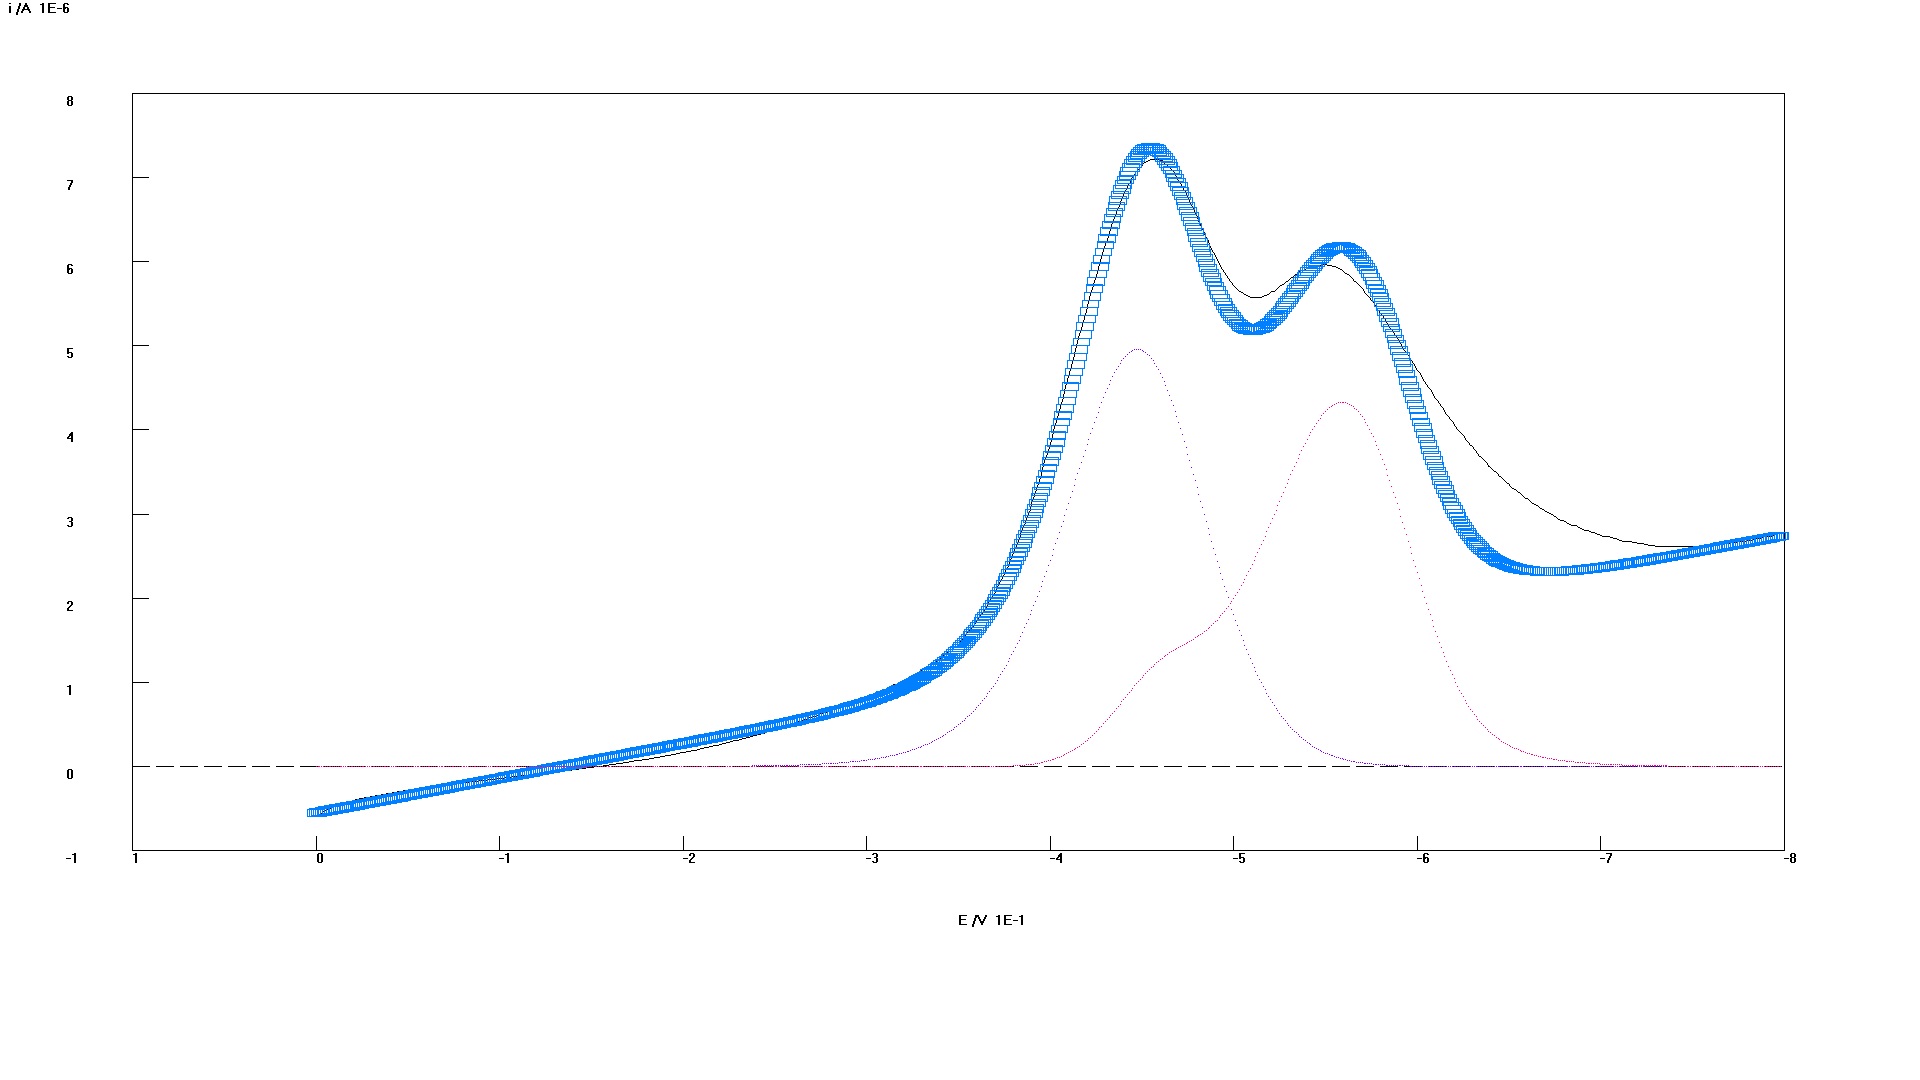
As above, scan rate = 1 kv/s, separate the overlapped peaks of CV.
Picture 5.
CV, scan rate = 5 kv/s, separate the overlapped peaks of CV.
Picture 6.
CV, scan rate 5 kv/s, separate the overlapped peaks of CV.
Picture 7.
CV
Picture 8.
CV
Picture 9.
Separate overlapped peaks of LV.
Picture 10.
Separate overlapped peaks of LV.
Picture 11.
A cyclic voltammetric simulation was fitted to experiement of an electrochemically mediated enzyme reaction involving any substrate and mediator concentrations.
electrochemical reaction: O+e=R
enzyme reaction: O+S = R+P
where R, O, S, and P are the reduced and oxidized forms of the mediator, substrate, and product, respectively.
scan rate is 10 mV/s, Uncompensated solution resistance is 3.4 ohm, cylinder electrode: radius is 4e-2 cm, length is 60 cm
(so electrode area show 1.5 square centimeters),
Determination of electrochemica Kinetic Constants: E0= -0.17 v, ks= 2e-3, alpha =0.5
Determination of Enzyme Kinetic Constants: kf=18, kb=20.
Please click here to download the parameter file,
and click here download the experiment data file .csv,