


AI math handbook calculator - Fractional Calculus Computer Algebra System software Home | list | math | function | coding | graphics | example | help | 中文
+ + + =

Example of Math Graphics 数学函数图

2.2. plane curve 2D

Content

  1. important plane curve
  2. Interactive plot with plot(x) 互动制图
  3. parametric plot with parametricplot(t,t)
  4. polar plot with polarplot(x)
  5. solve equation graphically with plot(x)
  6. dynamic plot with tangentplot(x) 制图
  7. complex plot with complexplot(z)
  8. Geometry 几何 with circle(1)
  9. plane graph 平面图 with plot2D(x)
  10. function plot with funplot(x)
  11. differentiate graphically with diff2D(x)
  12. integrate graphically with integrate2D(x)
  13. solve ODE graphically with odeplot(y'=x)
  14. animation with timer(1)

graph 2D

  • graph 2D

    Plot 制图

    A lot of the plot functions:
    plot(x), implicitplot(x=y), parametricplot(t,t), tangentplot(x), secantplot(x), polarplot(x), overlapplot(x)
    制图, 隐函数制图, 参数制图, 切线制图, 割线制图, 极坐标制图, 重叠制图.

    The plot( ) function plots a function, implicit function, parametric function, polar. The system auto plot when you enter formula.

      Interactive plot 互动制图

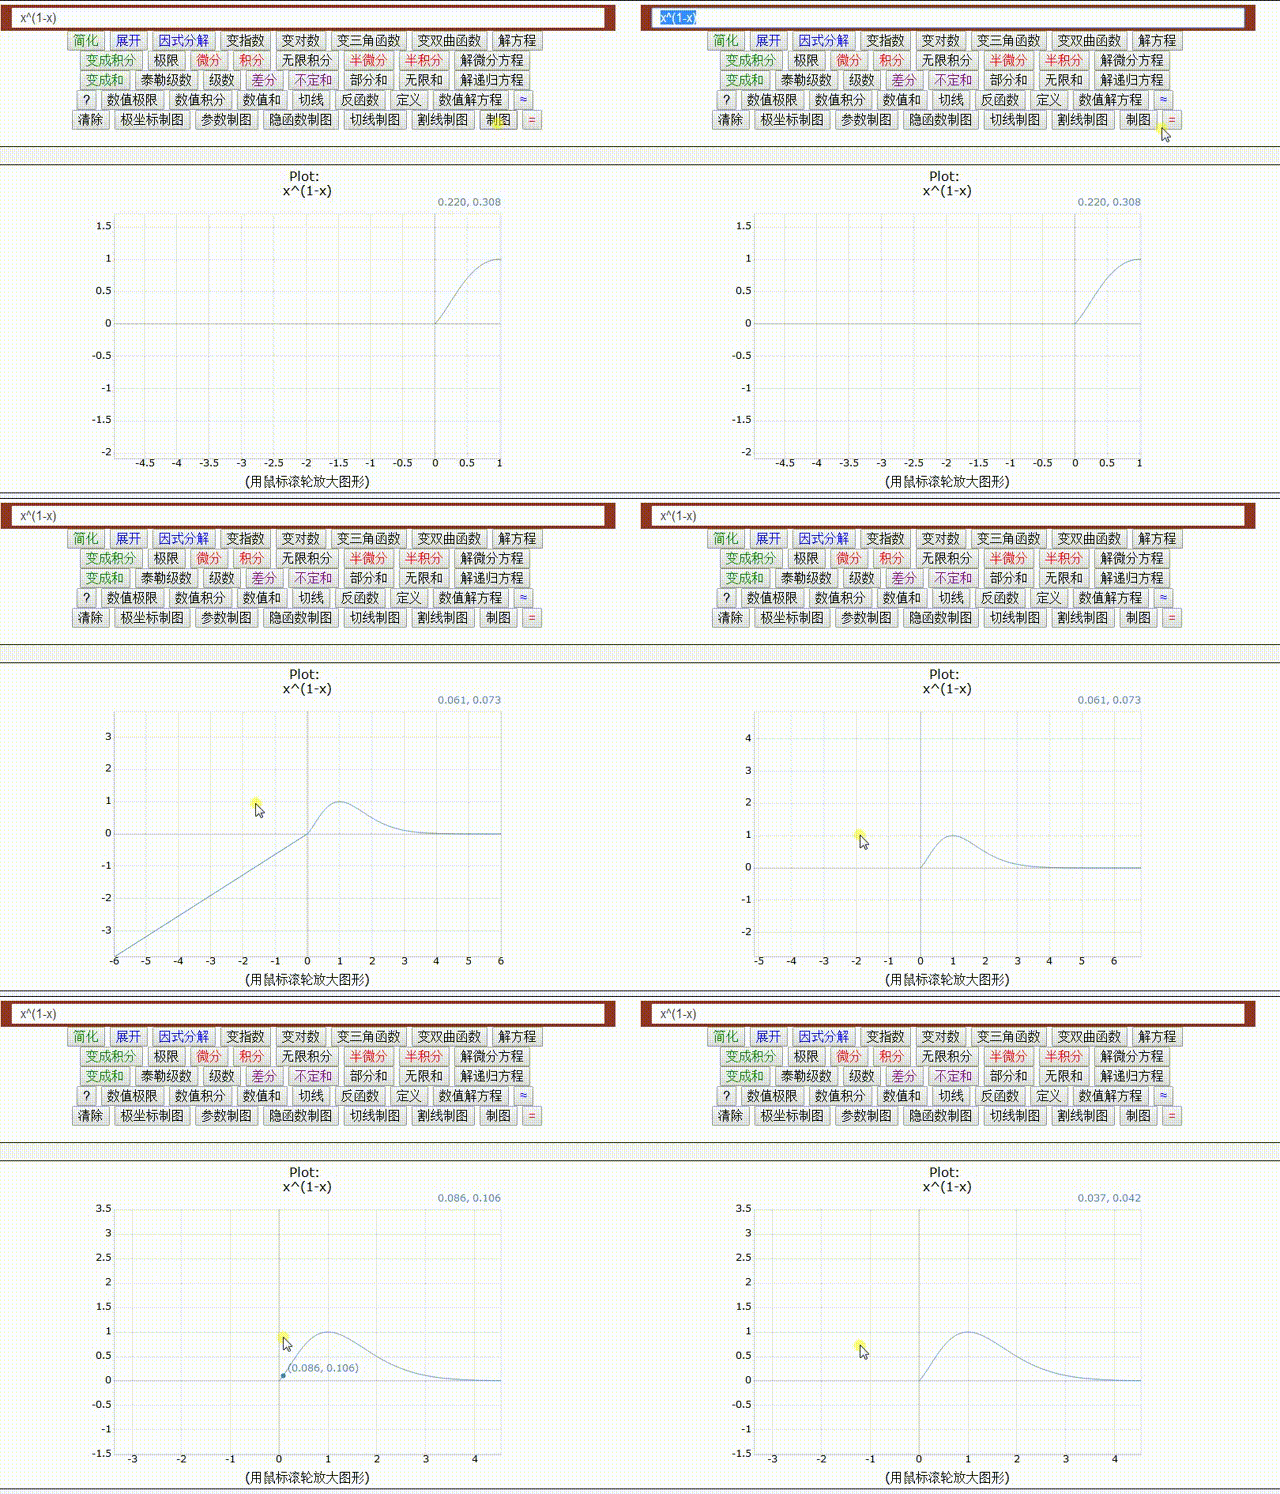
    1. plot 制图 The system auto plot when you hit the ENTER key, move mouse wheel on graph to zoom and move.
    2. important plane curve

      solve equation graphically

    3. input sin(x)-0.5=0, hit the ENTER key or click the plot button, then put mouse on cross between its curve and the x-axis to show the x-axis value for solution ,
      sin(x)-0.5=0
    4. plot sin(x) and x^2, put mouse on cross between two curves to show solution.
      sin(x) and x**2
    5. implicit plot

    6. implicit plot sin(x)=y to show a multivalue function,
      implicitplot( x=sin(y) )
    7. contour plot

    8. contour plot sin(x)-y to show a multivalue function,
      contourplot( sin(x)-y )
    9. fill in plot

    10. fill in plot sin(x) and sin(x)-1 to fil in between two curves of sin(x) and sin(x)-1,
      fiilinplot( sin(x) and sin(x)-1 )
    11. parametric plot

    12. parametric plot with default pararmter t
      x=sin(t),y=sin(4*t)
    13. polar plot

    14. polarplot( 2*sin(4*x) )
    15. polarplot( exp(cos(x))-2*cos(4*x)+sin(x/12)**5,x,0,50 ) butterfly

      dynamic plot

    16. tangent plot, by moving mouse on the curve to show tangent
      tangentplot( sin(x) )
    17. secant plot, by moving mouse on the curve to show secant
      secantplot( sin(x) )
    18. overlap plot

    19. overlap plot by clicking the overlap button or with overlapplot

      complex plot

      In order to plot complex function, you should convert it to complex by tocomplex(x) before plot. Use complex(x) to set variable for complex variable in real value, and Use complex(0,x) to set variable for complex variable in imag value. Get real part by re() and imag part by im(). e.g. convert log(x) to re(log(complex(x))).

    20. complex plot z,
      complexplot(z)

    21. plot complex function in real domain with complex2D( ), e.g.
      complex2D(sqrt(x))

    22. plot complex function in complex domain with complex3D( ), e.g.
      complex3D(sqrt(x)) for 20 graphes in one plot.

      More examples in complex function

      area plot with integral

    23. integral( ) plot the area under integral curve.
    24. Here are some particularly nice curve examples by plot function. you can put more plot together by the and. e.g.

    25. sin(x) and cos(x)
    26. line plot with vector(x,y) and complex(x,y), e.g. vector(1,2), complex(3,4)
    27. lines plot with length(x,x,x1,x2), e.g. length(x,x,1,2)
    28. curves plot with length(sin(x),x,x1,x2), e.g. length(sin(x),x,1,2)
    29. teliscope
    30. bridge
    31. target 靶 with circle( ) and polarplot( )
    32. butterfly 蝴蝶 with parametricplot( ) and polarplot( )
    33. complex2D(sqrt(x)) complex plot with complex2D( )
    34. trophy
    35. sin(x)-cos(y) net
      More examples in graph.

      Animation

      The plot( ) plots animation by adding the timer(x) into your formula.

      Geometry 几何

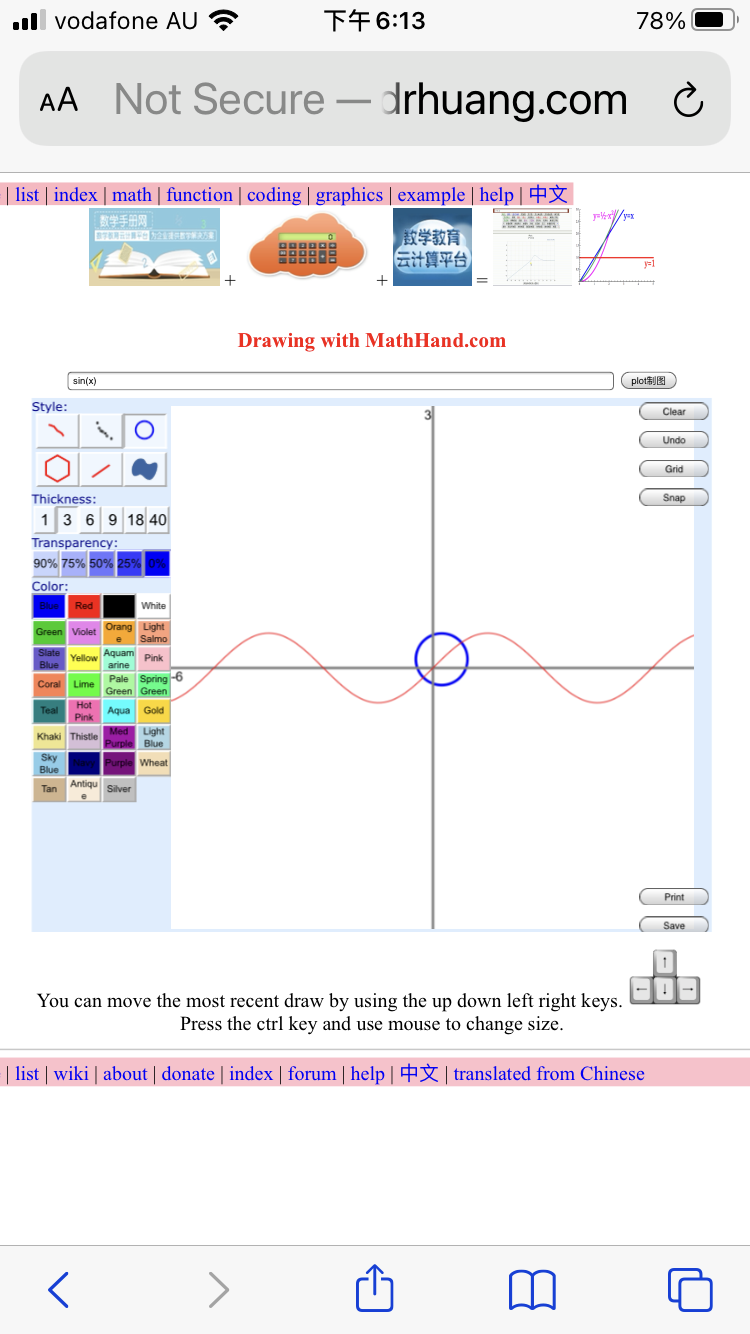
    36. Drawing

    37. semicircle with radius 1, 半园
      semicircle(1)
    38. integral area by integral( )
      integral(semicircle(2))

    39. circle with radius 2, 园
      circle(2)
    40. oval with x radius 2 and y radius 1, 椭园
      oval(2,1)
    41. disc with radius 2,
      disc(2)
    42. ring with radius 1 and 2,
      ring(1,2)
    43. tangent 切线 at x=0 by default,
      tangent( sin(x) as x=1 )

      Dynamic tangent 切线

    44. click tangentplot( ) tangent 切线 at x=0 by default, then put mouse over curve to show a tangent line and equation,
      tangentplot( sin(x) )

      Dynamic secant 割线

    45. click secantplot( ) secant at x=0 by default, then put mouse over curve to show a secant,
      secantplot( sin(x) )

      more examples on graph

      plane graph 平面图

    46. important plane curves

      plot2D

      plot2D a curve, derivative and integral curve in 2D and polar, and calculate expression at any x and y=0.
    47. plot2D(sin(x))

      the 3-dimensional object (x,y,t) in 2D plane

    48. plot2D the 3-dimensional object (x,y,t) in 2D plane, manually change the t value by a slider, or tick the auto t checkbox for auto change.
      plot2D(x*y-t-1)

      function plot with funplot

    49. funplot a curve, inverse curve in 2D, and calculate expression at any x and y=0.

      differentiate graphically with diff2D

    50. diff2D numericallyly and graphically differentiate a function on graph.
      diff2D(sin(x)) first order derivative

      semidifferentiate graphically with semid2D

    51. semid2D numerically and graphically semidifferentiate a function on graph.
      semid2D(sin(x)) half order derivative graph
      d(x=>sin(x),x,0.5) half order derivative

      differentiate graphically with d(x=>sin(x))

      d(x=>sin(x)) first order derivative graph
      d(x=>sin(x),x,2) second order derivative
      d(x=>sin(x),x,0.5) half order derivative

      integrate graphically with integrate2D

    52. integrate2D numerically and graphically integrate a function on graph. it convert the integrate( ) to the integrates(x=>sin(x)) for integral graph.
    53. integrate2D(sin(x))

      integrate graphically with integrates(x=>sin(x),x)

    54. integrates(x=>sin(x),x)

      plot2D 制图2D

      The plot2D( ) plots a list of data, function, implicit function, parametric function, piecewise function, polar plot, derivative, integral, etc.

      Here are some particularly nice examples by plot function

    55. plot2D(x)
    56. sin(x) and cos(x-phase)
    57. Bessel function of the first kind — the first five Bessel function of the first kind of real or complex order n of a real or complex number.
    58. Bessel functions of the first or second kind for both positive (blue) and negative (red) real order, and derivative.
    59. Watt Curve
    60. Tangent Cotangent
    61. Fourier Series

      parametric3D

    62. slinky
    63. Cornu Spiral - the Fresnel cosine and sine integrals.
    64. Mystery Curve

      solve ODE graphically with odeplot

      solve y'=f(x,y) graphically

      Some differential equations cannot be solved symbolly, but can be solved graphically by a plot function odeplot( ).
      odeplot graphically solve Ordinary Differential Equation (ode). The odeplot( ) can be used to visualize individual functions, First and Second order Ordinary Differential Equation over the indicated domain. Input the right hand side of Ordinary Differential Equations, y"=f(x,y,z), where z for y', then click the y'= checkbox for first order differential_equation, or click the y"= checkbox for second order differential_equation by a differential equation y'=f(x,y) graphically.
    65. y' = cos(x)
    66. odeplot graphically solve Ordinary Differential Equation (ode). The odeplot( ) can be used to visualize individual functions, First and Second order Ordinary Differential Equation over the indicated domain. Input the right hand side of Ordinary Differential Equations, y"=f(x,y,z), where z for y', then click the y'= checkbox for first order differential_equation, or click the y"= checkbox for second order differential_equation, by default it is first order ODE.
    67. y''=y'-y for second order ODE

      Animation

      The plot2D( ) plots animation by clicking the animate checkbox and/or adding the timer(x) into your formula.

    68. flowering by polarplot( sin(4*x)*timer(6) )

    69. I love you by my heart. abs(x)^(2/3)+0.9*sqrt(3.3-x^2)*sin(pi*x*timer(30))
    70. A plane curve which is progressively drawn. (Cycloid)
    71. The Cycloid is the orbit of a point on a circle rolling along a straight line. Here you can see how this is done precisely, with multiple curve plotting.
    72. By the same principle, the astroid (cos^3(t),sin^3(t)) is the orbit of a point on a circle of radius 1/4 rolling inside a fixed circle of radius 1.
    73. We have also the astroid with 3 arcs.
    74. Zooming effect on the curve sin(1/x).
    75. A moving tangent along a plane parametric curve (cardioid).
    76. The moving tangent along the astroid has a special property: the segment of the tangent cut out by the coordinate axes is of constant length.
    77. How an ellipse is drawn by a point on a segment of fixed length with two extremities on the x and y axes respectively.
    78. An animation which illustrates the functions sin and cos as vertical and horizontal positions of a moving point on a circle.
    79. Rotating and growing trefoil.
    80. Cornu Spiral - the Fresnel cosine and sine integrals.
    81. choreographies
    82. coloring butterfly
    83. coloring square
    84. Unwrapping Circle
    85. Weierstrass

    Reference 参阅

  • example 例题
  • graph 制图
  • graphics 制图法
  • drawing 画画

    <= back - content - Next => 


    See Also

    
    Home | about | list | wiki | donate | index | forum | help | chat | contact | translated from Chinese | 中文